The Bond Market at the 5% Threshold
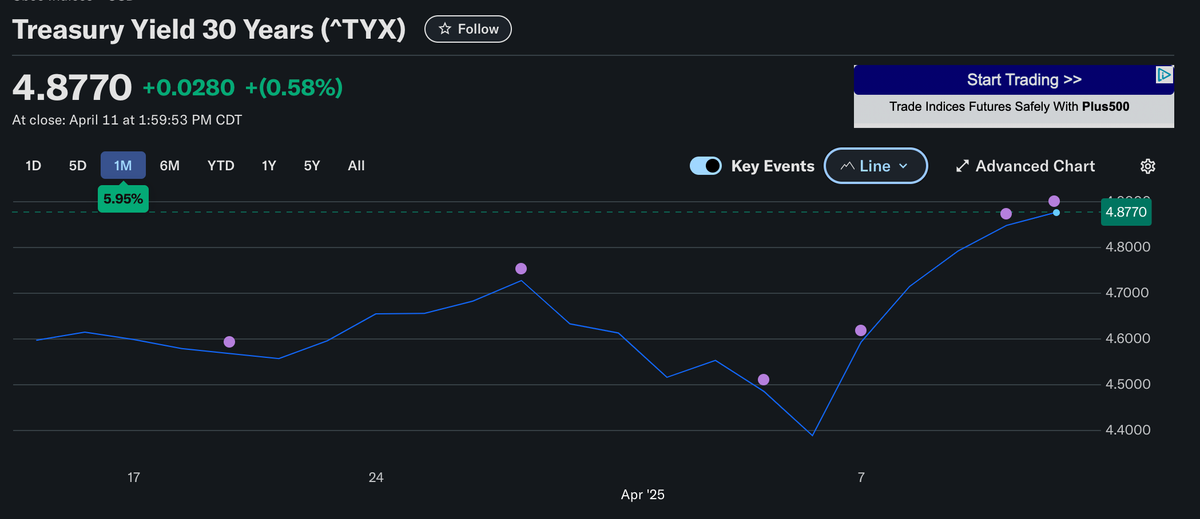
The 30-year Treasury yield approached 5% on April 11, 2025. Since 2008, long-term rates have stayed below this line. Crossing it doesn't guarantee collapse, but takes us off the map. We don't know what breaks when borrowing costs stay high or which assumptions stop working.

1: The Border
On April 11, 2025, the 30-year Treasury yield briefly approached 5%. Quietly. And then it fell back. Just enough to preserve the illusion that nothing had changed.
But something had.
Since 2008, long-term US interest rates have lived below that line. Not always far below. Not without volatility. But below. The last time the 30-year yield held above 5% for any sustained period, the year started with "19."
We've had recessions since then. We've had war, inflation, and financial crisis. But in every case, yields eventually retreated. The market absorbed each shock and returned to familiar territory of never straying beyond our frame of reference for long.
5.0 is the edge of that world.
Crossing it doesn't guarantee collapse. But it does something more unnerving: it takes us off the map. We don't know what breaks when long-term borrowing costs stay high. We don't know which assumptions stop working. We don't know what replaces the old rules.
And the longer we hover near the line, the more fragile the distinction becomes between not crossing
And already living with the consequences.
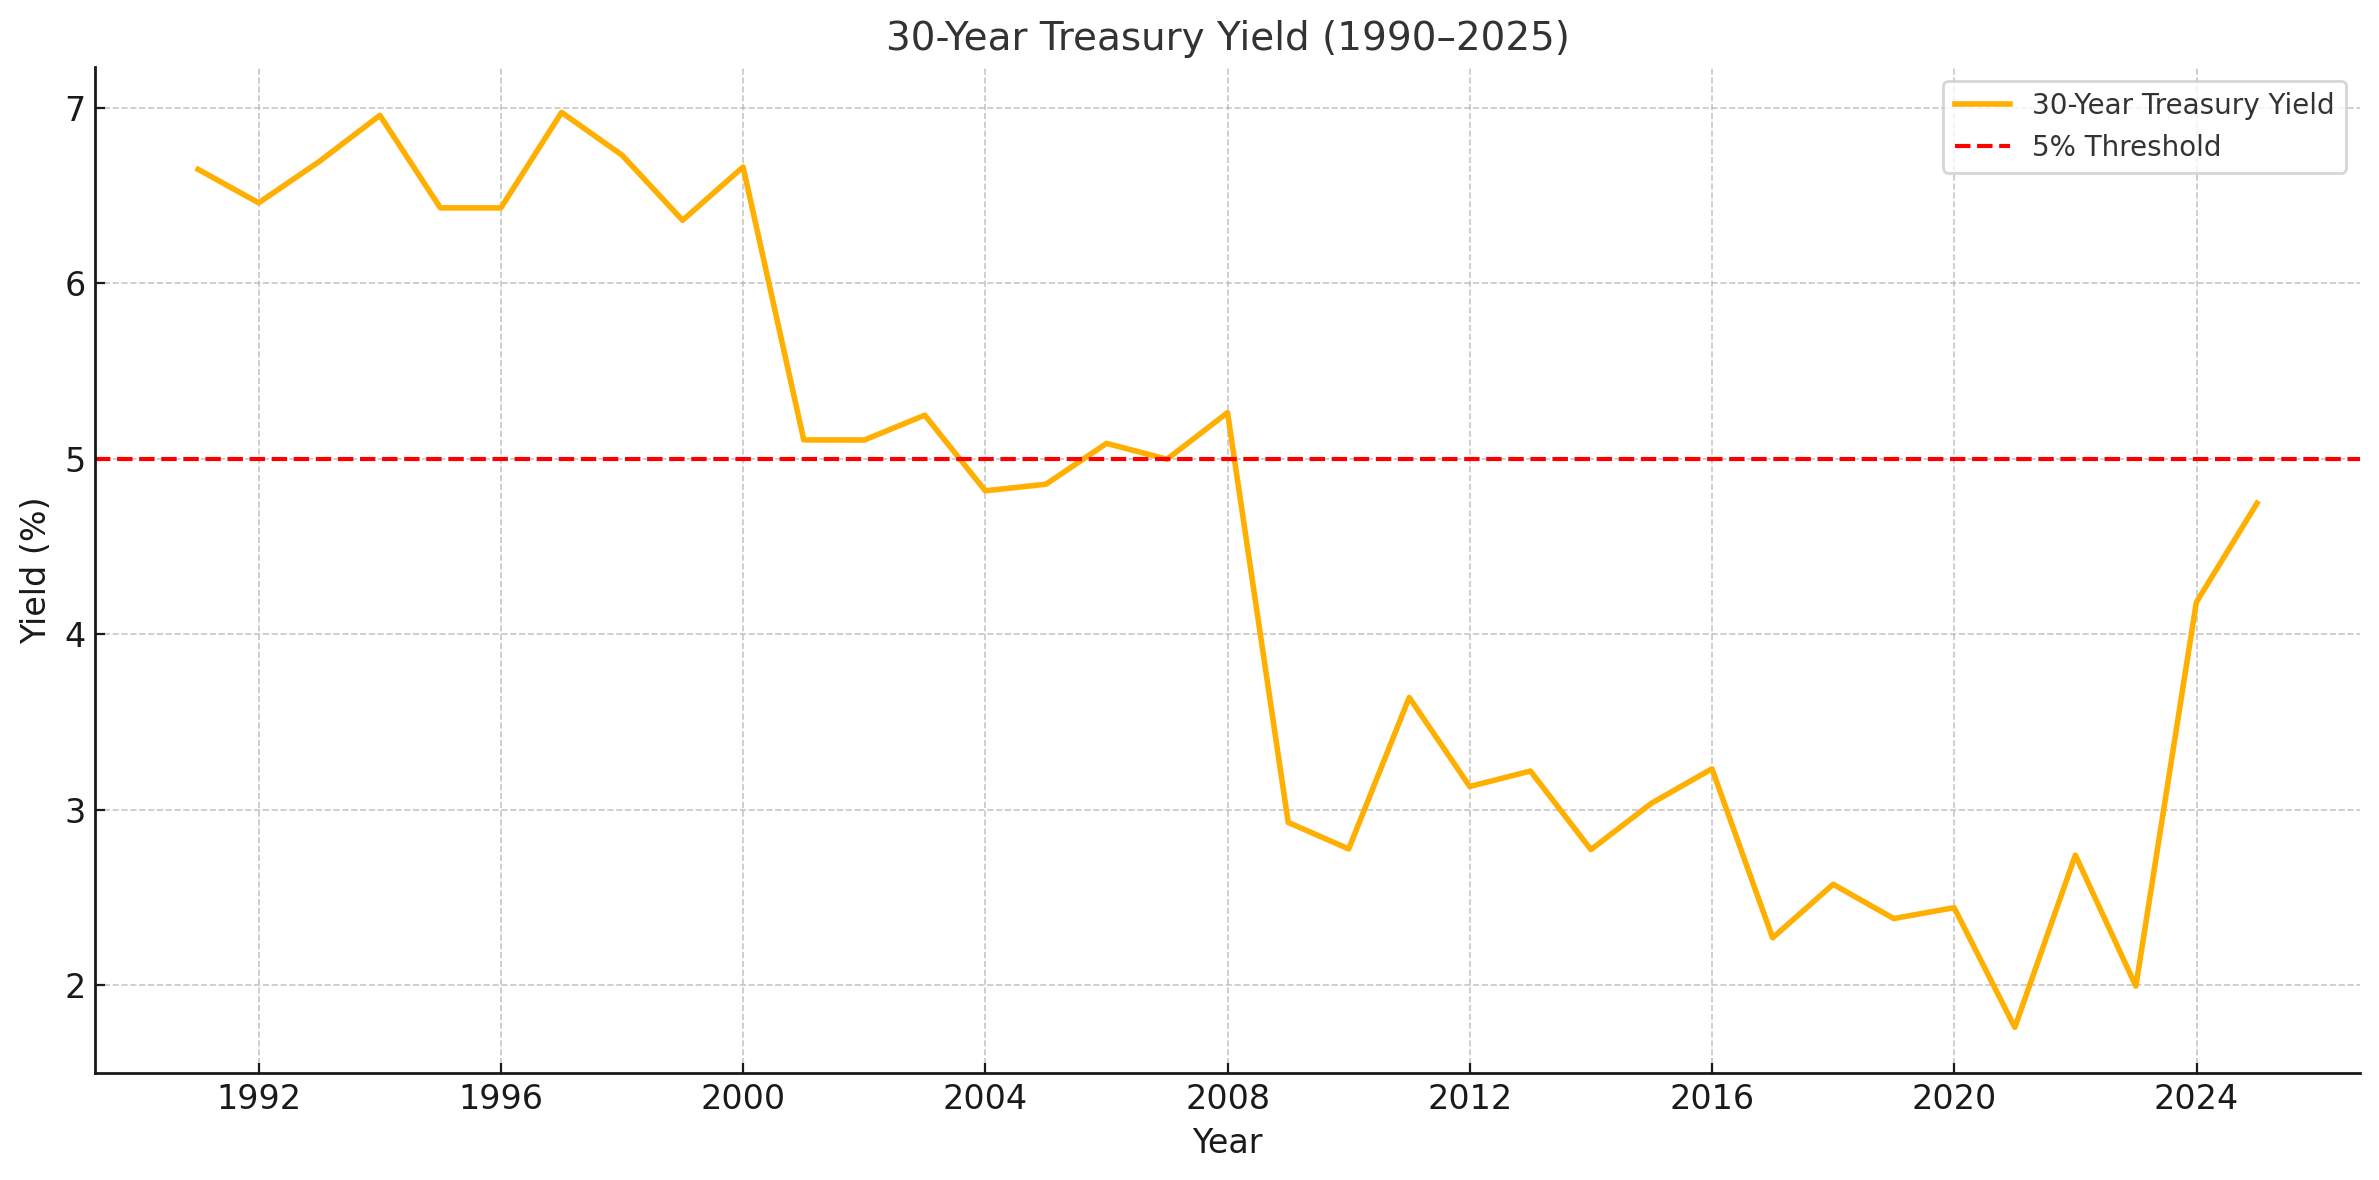
Figure 1: 30-Year Treasury Yield (1990–2025). For most of the past three decades, the yield on the 30-year Treasury has stayed below 5%. Brief breaches occurred in the 1990s and early 2000s — but the April 2025 spike marked a return to territory not seen since before the Global Financial Crisis.
2: What Is a Treasury Yield?
A Treasury yield is the interest the government pays to borrow money over a given time. When people refer to "the 10-year" or "the 30-year," they're talking about these yields — benchmarks for everything from mortgage rates to corporate loans.
When yields go up, borrowing costs rise. Not just for the government, but for everyone: banks, businesses, homeowners, students.
Treasury yields move in response to inflation expectations, economic growth, and (critically) confidence. Confidence in the economy. Confidence in policy. Confidence that the US will pay its debts.
Yields also move inversely to bond prices. When people sell Treasuries, prices fall and yields rise. That's not just market noise. It's a signal. Sometimes subtle. Sometimes loud enough to shake the White House.
These yields form the backbone of the US financial system and, by extension, the global economy. The 10-year Treasury yield serves as the risk-free rate in countless financial models, from corporate capital budgeting to pension fund allocations. It's the baseline against which all other investments are measured.
The transmission mechanisms are direct and powerful: 30-year mortgage rates typically run 1.5-2 percentage points above the 10-year Treasury yield. Corporate debt prices according to a "spread" over comparable Treasury yields. The higher the perceived risk, the wider the spread. Even auto loans and credit card rates respond to shifts in the Treasury curve, albeit with lags and friction.
Historically, Treasury yields have moved through distinct regimes. The 1970s saw yields climb steadily from 6% to over 15% as inflation took hold. The 1980s began with Paul Volcker's Fed pushing rates to unprecedented heights to break inflation, followed by a long, steady decline. From 1981 to 2020, the secular trend in yields was downward, creating a tailwind for asset prices, borrowers, and economic growth.
A spike in yields can mean many things: fear of inflation, doubts about fiscal discipline, or simply a rush to safer or better-paying alternatives abroad.
Understanding Treasury yields isn't about bond math. It's about understanding how the price of time gets decided, day by day, by markets that don't need permission to panic.
3: The Shape of the Future
Bond yields don't just tell us how expensive debt is. They tell us what the future might look like.
A steep yield curve, where long-term rates are much higher than short-term ones, usually signals growth and inflation. Investors demand more to lend for longer because they expect stronger returns, or more risk.
A flat or inverted yield curve — where long-term rates fall below short-term ones—is often a warning. It suggests that investors think the economy will slow or even contract. Historically, inverted curves have preceded most US recessions.
Yield curve inversions defy intuitive logic. Why accept lower returns for longer commitments? The answer lies not in yield-seeking, but in fear-hedging.
When investors believe a recession is approaching, they lock in whatever yield is available on longer maturities before rates fall further. This "rush to duration" pushes long yields below short ones. It's not about maximizing returns. It's about minimizing regret.
History validates this caution. Since 1955, all but one US recession has been preceded by an inverted curve. Not all inversions lead to recessions — but the signal is strong enough that markets treat it as more than coincidence. And in a highly leveraged economy, this self-fulfilling aspect matters as much as the underlying conditions.
Today, the yield curve isn't just a shape. It's a signal. And it's blinking red.
Long-term yields rising toward 5% in a world still carrying pandemic-era debt levels, high consumer leverage, and inflation risk isn't a neutral shift. It's a repricing of time, credit, and stability.
A 30-year bond doesn't pay you back for three decades. If it yields 5%, that's the market's statement on how much risk (or return) is embedded in that horizon. When that number changes quickly, it's not just rates moving.
It's expectations breaking.
4: The Cost of Living Changes
Enter the Chans. A household of four: a married couple, two kids, and a $100,000 income. They are not extravagant. They are not struggling. But their balance sheet is sensitive to interest rates.
They have a $400,000 mortgage, a car loan, and some credit card debt. They buy groceries, pay tuition, and save what they can. In the world below 5%, they're stable. In the world at 5%, they feel pressure. In the world above it, the financial equation becomes unsolvable.
This section breaks down the personal economic impact across four core household levers:
4.1: Housing — When the Math Stops Working
World 1: The Subsidy Economy (Below 5%)
The Chans bought their house in 2018 at a 3.5% fixed rate. Their mortgage payment is about $1,800 a month. Manageable, predictable, and the foundation of their budget.
If they moved today, a new mortgage at 6.8% would cost them nearly $900 more per month for the same house. They're not moving.
Nationally, that logic holds. People with sub-5% mortgages are staying put. Sellers have vanished. Buyers are priced out. The housing market hasn't crashed. It's paused.
World 2: The Friction Zone (At 5%)
If yields stabilize at 5%, mortgage rates remain around 7% or higher. The Chans don't just stay. They stop dreaming.
No move. No second home. No cash-out refinance for college. They cut back to preserve their financial position.
Transaction volume across the US stays low. New construction slows. Housing turnover — the engine of the real estate market — stalls.
World 3: The Rationing Regime (Above 5%)
Mortgage rates push above 8%. The Chans aren't buying, but neither is anyone else.
New buyers face monthly payments up 40–50% compared to pre-pandemic levels. Affordability collapses. Young families delay entry. Older owners defer downsizing.
It's not just a housing freeze. It's a generational block.
4.2: Credit Cards — From Revolving to Recurring
World 1: The Subsidy Economy (Below 5%)
The Chans carry a modest credit card balance. Their average APR is around 15%. High, but manageable. They pay it down aggressively.
Banks are still issuing new credit. Offers arrive in the mail. Access to revolving credit is frictionless.
World 2: The Friction Zone (At 5%)
Rates climb. APRs approach 24% for prime borrowers. The Chans' monthly interest expense on the same balance jumps by over 50%.
Banks tighten lending. New cards get stingier. Minimum payments rise.
The Chans shift from convenience borrowing to necessity. Credit becomes a burden, not a bridge.
World 3: The Rationing Regime (Above 5%)
APRs breach 30%. Promotional offers vanish. Late fees increase. Credit availability shrinks.
The Chans now pay hundreds each month in interest just to tread water. Missed payments spike nationwide.
And access doesn't just become expensive. It becomes scarce.
4.3: Auto Loans — The Price of Mobility
World 1: The Subsidy Economy (Below 5%)
A reliable used car loan sits around 4.5%. The Chans bought their hybrid at 3.9% in 2021. They pay about $440 per month.
Auto leasing is common. Dealers offer 0% promotions. Financing feels like part of the sale.
World 2: The Friction Zone (At 5%)
Auto loan rates rise to 7-8%. A new $30,000 vehicle now costs over $600/month in payments. Leasing becomes less favorable.
The Chans delay their next vehicle upgrade. So does everyone else.
New car sales slump. Used car prices firm up. Auto affordability metrics flash red.
World 3: The Rationing Regime (Above 5%)
Auto loan rates breach 9%. Monthly payments hit record highs. Insurance premiums rise in tandem. Leasing dries up.
The Chans look to keep their car for another 5-7 years. Public transportation gains appeal. EV purchases slow.
And car ownership stops feeling like a given.
4.4: Refinancing — The Vanishing Safety Valve
World 1: The Subsidy Economy (Below 5%)
The Chans refinanced in 2020. That decision saved them over $300/month. Millions did the same.
It was the single most powerful financial lever available to middle-income households. Refinancing created margin, relief, and spending power.
It was also temporary.
World 2: The Friction Zone (At 5%)
Refinancing no longer makes sense. Existing rates are better than any new offer. The Chans can't access their equity cheaply.
Cash-out refis shrink. HELOCs tighten. Credit markets thicken but don't flow.
Homeowners feel trapped. Lenders see less business. And rate locks become financial handcuffs.
World 3: The Rationing Regime (Above 5%)
The refinancing market barely exists. Anyone who didn't act during the lows is stuck. Mortgage brokers pivot to new products. Or leave.
The safety valve has closed. And in a high-rate world, pressure builds with nowhere to go.
4.5: Transition to Systemic Impacts
We've now crossed the invisible border that separates the familiar from the unknown. The 5% threshold isn't just a number. It's a boundary between financial ecosystems.
In World 1, The Subsidy Economy, we witnessed easy refinancing, accessible credit, and predictable housing turnover. This was the known territory.
In World 2, The Friction Zone, we're experiencing the pressure points: housing markets seizing, credit tightening, and mobility costs rising. This is the contested ground.
In World 3, The Rationing Regime, we glimpse a landscape governed by entirely different rules where household financial equations fail and expectations must be rewritten.
The Chans' experience isn't isolated. It's emblematic. According to Federal Reserve data, nearly 67% of American households with debt face similar interest rate sensitivity. Their constraints mirror the broader economic reality: when 30-year Treasuries cross 5%, approximately $8.2 trillion in household debt reprices upward. What happens at the kitchen table presages what happens in the boardroom and the bond market.
But the impact extends far beyond family budgets. As we cross from one world to another, entire systems begin to strain and adapt.
5: Systemic Pressure Points
The Chans feel rising yields through mortgage statements and credit card APRs. But they're not alone. Governments, markets, and institutions face the same math at a far larger scale.
This section shifts focus from households to systems. From budgets to bond desks. From monthly payments to national balance sheets.
And it asks the same question: What happens when the cost of time changes?
5.1: Government Debt — When Interest Becomes the Budget
The US government owes more than $36.22 trillion in federal debt as of April 2025. Much of it rolls over — matures and gets reissued — at whatever interest rate the market demands.
That rate used to be low. It isn't anymore.
World 1: The Subsidy Economy (Below 5%)
From 2010 to 2021, the average interest rate on federal debt hovered around 1.6% to 2.5%. Debt grew, but the cost to carry it remained modest. In FY 2020, interest payments were under $350 billion, or less than 10% of federal revenue.
Borrowing was effectively free. The US ran massive deficits and still paid less to finance its debt than it did in the 1990s.
Markets didn't punish this. They rewarded it. Investors kept buying. The Fed kept rates near zero. Foreign buyers showed up. The math worked.
World 2: The Friction Zone (At 5%)
In 2025, the cost of debt is no longer theoretical. It's visible in the budget.
Interest payments are projected to total $952 billion in FY 2025, accounting for 18.4% of federal revenues. This marks a significant increase from previous years and reflects the impact of refinancing existing debt at higher rates.
The Treasury faces the challenge of refinancing trillions in maturing debt at rates substantially higher than when the debt was originally issued. This situation is exacerbated by the fact that a significant portion of the debt is short-term, increasing rollover risk.
This isn't about new spending. It's the cost of existing debt repriced at higher rates.
Analysts estimate that every 1 percentage point rise in average interest rates adds approximately $250-$300 billion in annual federal interest payments.
At 5%, interest isn't a footnote. It's the second-largest line item in the federal budget.
World 3: The Rationing Regime (Above 5%)
This doesn't mean default. But it does mean trade-offs. Every dollar spent on interest is a dollar not spent on infrastructure, R&D, child care, or tax relief.
Even if the US retains reserve currency status and keeps borrowing, the price of borrowing starts to reshape policy. Stimulus becomes riskier. Bailouts get harder to justify. Big bills start to look politically radioactive.
And because Treasury yields influence everything else, this debt burden is both symptom and cause. Higher rates drive more borrowing costs. Higher borrowing costs push yields further up. The cycle feeds itself.
In a high-yield world, debt doesn't just limit the future.
It defines it.
5.2: Foreign Buyers — When Confidence Becomes Conditional
The US bond market relies on foreign confidence. Countries like Japan and China collectively hold trillions in Treasuries. Not necessarily out of loyalty, but because Treasuries have long been the world's safest, most liquid store of value.
What happens when that confidence wavers?
World 1: The Subsidy Economy (Below 5%)
Foreign central banks keep buying. US debt remains the gold standard. Capital flows in, not out. Even when crises hit elsewhere, investors move money into Treasuries.
The dollar holds its strength. Yields remain contained. America remains the preferred destination for crisis capital.
World 2: The Friction Zone (At 5%)
Higher yields begin to reflect something other than risk-free comfort. They start to price uncertainty.
China trims its holdings. Japan begins diversifying. As of January 2025, China holds $760.8 billion in US Treasuries, while Japan holds $1.079 trillion — both down from prior peaks.
The total foreign share of Treasury ownership declines. The dollar weakens slightly against major currencies. FX markets jitter.
Yields rise not just because the Fed is tightening or inflation is sticky — but because foreign demand is thinning.
Trust doesn't vanish. But it starts to come with conditions.
World 3: The Rationing Regime (Above 5%)
Foreign outflows accelerate. Treasury auctions get choppier. The dollar falls against the euro and yen. Bid-to-cover ratios drop. Risk premiums creep into supposedly risk-free instruments.
Bid-to-cover ratios, or the volume of bids received in a Treasury auction relative to the amount sold. A 2.5 ratio means investors bid for $2.50 of bonds for every $1 actually issued. When this number falls, it signals waning demand. Not just for that auction, but for US debt itself.
This isn't about default risk. It's about the end of automatic trust.
And in a high-yield world, confidence becomes just another thing that has to be earned.
5.3: Policy Limits — When the Fed Can't Step In
The Federal Reserve can't solve this one.
When inflation is high and bond yields are rising, the Fed faces a narrowing corridor: raise rates and risk breaking the economy, or hold steady and risk losing control of inflation expectations.
World 1: The Subsidy Economy (Below 5%)
The Fed still has flexibility. Inflation is contained. The yield curve responds predictably to policy changes. When the Fed cuts rates, mortgage and auto loan rates fall. When it raises them, risk assets cool. The playbook works.
Coordinated action with other central banks is possible. Liquidity tools are available. Emergency facilities are on standby but rarely needed.
World 2: The Friction Zone (At 5%)
Now the signals are murkier.
Bond yields rise even when the Fed holds policy steady. Long-end rates start to reflect fiscal risk, not just monetary settings. Rate cuts risk reigniting inflation. Rate hikes risk recession.
International coordination becomes harder. The European Central Bank is easing. The Bank of Japan is intervening. The People's Bank of China is managing capital outflows. And the Fed — caught in the middle — starts to look reactive, not proactive.
The market questions whether the Fed can thread the needle.
World 3: The Rationing Regime (Above 5%)
The Fed's toolbox shrinks.
With inflation still elevated and long-term yields breaking higher, even hinting at rate cuts risks triggering a bond market revolt. Investors demand more yield to compensate for policy uncertainty. Treasury auctions weaken. Liquidity conditions deteriorate.
The Fed can't intervene as forcefully as it did in 2008 or 2020. It can't buy bonds freely in a world where inflation is above target. The dual mandate (price stability and full employment) becomes a conflict, not a guide.
Academic research highlights this bind: in high inflation regimes, unconventional monetary tools — like large-scale asset purchases — may lose potency and risk credibility spillovers. As emphasized by Bernanke, Reinhart, and Sack (2004), bond market reactions to perceived inflation slippage can undo central bank efforts.
Further, research from Kiley and Mishkin (2024) and Afronzi, et al. (2024) suggests that central banks' expanding roles in financial stability can complicate inflation targeting, and that shifts in central bank preferences can lead to persistent high-inflation regimes.
And so the Fed waits. Talks. Signals. But does less.
Because in a high-yield world, even the central bank has limits.
5.4: FX Markets — When the Dollar Stops Behaving
The dollar has long been the financial world's anchor. When markets tumble, capital flows into dollars. When foreign central banks rebalance, they buy Treasuries. When in doubt buy green.
But that anchor depends on relative strength. And rising yields can pull both ways.
World 1: The Subsidy Economy (Below 5%)
A stable Treasury market supports dollar demand. US bonds yield more than European or Japanese equivalents. That yield differential attracts foreign capital.
FX volatility is modest. The dollar behaves like the world's reserve currency should.
World 2: The Friction Zone (At 5%)
Yields rise faster than inflation. That draws capital, but also starts to rattle confidence.
The dollar strengthens against emerging market currencies but begins to lose ground to the euro and yen. Not dramatically, but enough to be noticed.
US exports take a hit. Global companies report currency headwinds. Treasury sales abroad begin to underperform.
The dollar's fortress status shows its first cracks.
World 3: The Rationing Regime (Above 5%)
The dollar weakens despite high yields. That's not normal.
Why? Because FX markets aren't just looking at returns. They're looking at risk. And if confidence in US fiscal discipline erodes, or if global buyers decide yields are rising for the wrong reasons, they move elsewhere.
The euro appreciates. The yen stabilizes. Gold catches a bid. Countries diversify reserves.
5.5: Equity Markets — When Valuations Reprice
In a high-yield environment, equity valuations face significant pressure due to the increased discount rates applied to future earnings. This is particularly impactful for growth stocks, which rely heavily on projected future cash flows. As bond yields rise, the present value of these future earnings diminishes, leading to valuation compression. For instance, the S&P 500's forward price-to-earnings (P/E) ratio recently dropped to 18.01, its lowest since November 2023 and below the 10-year average of 18.63.
Academic literature supports this phenomenon. Gilchrist and Zakrajsek (2007) found that a 1 percentage point increase in the user cost of capital leads to a reduction in the investment rate of 50 to 75 basis points. Similarly, Philippon (2006) showed that firm-level investment is negatively correlated with corporate bond yields, meaning high yields translate into lower capital spending and future growth.
Industry-Specific Impacts
- Technology and Growth Sectors: These sectors are particularly sensitive to rising yields due to their reliance on future earnings. Higher discount rates reduce the present value of these earnings, leading to sharper declines in stock prices.
- Financials: Conversely, financial institutions like banks and insurance companies may benefit from higher interest rates, as they can achieve better margins on loans and investments. Research presented at the American Economic Association (2024) supports this, showing that banks tend to outperform other sectors during high-rate regimes.
- Real Estate and Utilities: These sectors often suffer in high-yield environments due to their capital-intensive nature and the increased cost of borrowing. Recent work by Darmouni and Siani (2022) finds that many firms have responded to tighter financial conditions by accumulating liquidity rather than investing, compounding downward pressure on valuations.
Understanding these dynamics is crucial for investors navigating the complexities of equity markets amid fluctuating interest rates.
5.6: Real Estate — When the Market Freezes in Place
Real estate isn't just a financial asset. It's a market built on movement: people upgrading, downsizing, relocating, refinancing. All of that depends on liquidity, or how easily assets can be bought or sold without affecting their price.
Liquidity depends on rates.
World 1: The Subsidy Economy (Below 5%)
When yields were low, housing moved. Cheap financing kept monthly payments manageable even as home prices climbed. Sellers could cash out and trade up. Buyers could stretch a little further.
Refinancing acted as a lubricant — allowing homeowners to replace old loans with new ones at lower interest rates. Housing turnover kept inventory fresh. The market cleared, even if slowly.
Builders had predictability. Cities had tax growth. And buyers, even in hot markets, had some margin for error.
World 2: The Friction Zone (At 5%)
Now, everything sticks.
Rates over 7% have frozen the market. Nearly 80% of homeowners have mortgages below 5%. They won't sell. New buyers can't afford current prices with higher rates. And builders face tighter credit, higher input costs, and wary investors.
This is a standoff. Not of will, but of math.
World 3: The Rationing Regime (Above 5%)
If yields stay elevated, this freeze becomes structural.
Cap rates – Capitalization rates: a property's annual net operating income divided by its purchase price. A 5% cap rate means a $10 million building generates $500,000 yearly. When rates rise, investors demand higher cap rates — which mathematically forces property values down.
And in a high-yield world, real estate doesn't just lose momentum. It loses mobility.
The result isn't a crash. It's a slow paralysis.
Conclusion: Three Worlds, One Line
On April 11, 2025, the 30-year Treasury yield briefly crossed 5%, peaking at 5.05% before settling at 4.97% by day's end. This surge marked the largest weekly gain since 1987, reflecting a dramatic shift in market dynamics. The spike unsettled the White House, spooked foreign buyers, and reminded markets that this line — arbitrary as it may seem — is real.
Not because something breaks the instant it's crossed. But because everything starts repricing — adjusting the value of assets based on new interest rate expectations.
This isn't just a story about rates. It's a story about thresholds.
We've now lived in three worlds:
- World 1: The Subsidy Economy. Where debt was cheap, refinancing was easy, valuations soared, and policy tools worked as expected. The world we thought we understood.
- World 2: The Friction Zone. Where the old math no longer holds, the future becomes more expensive, and institutions — families, governments, markets — start to strain. The world we're trying to manage.
- World 3: The Rationing Regime. Where Treasury market volatility has increased markedly as yields approach and occasionally breach the 5% threshold. Market participants show increasing sensitivity to auction results and inflation data releases, with larger price movements following each report.
The difference between these worlds isn't just numeric.
It's systemic. Psychological. Political. Once yields cross 5%, we don't just risk higher costs. We risk losing the tools that helped us manage those costs.
The border is still there. But the landscape is changing. And the longer we stay near 5%, the less clear it becomes whether we're standing at the edge.
Or already living past it.